美國各州受教育程度列表
美國教育 |
|---|
| 概要 |
| 問題 |
| 受教育程度 |
|
|

美國各州受教育程度列表:
This list of U.S. states and territories by educational attainment covers the 50 美國 美國州份, the 華盛頓哥倫比亞特區, and the 美國領地 of 波多黎各 and their populations' 學歷 for all people of at least 25 years of age. The four other inhabited U.S. territories (美屬薩摩亞, 關島, the 北馬里亞納群島, and the 美屬維京群島) are listed separately.
The data source for the main list is the 美國普查局's American Community Survey in 2021.[1] The data source for the territories table is from 2010 U.S. Census Bureau data, because those territories are excluded from the American Community Survey.[2][3] The American Community Survey is a large demographic survey collected throughout the year using mailed questionnaires, telephone interviews, and visits from Census Bureau field representatives to about 3.5 million household addresses annually, regardless of their legal immigration status. The survey does not measure graduation rates from different educational institutions, but instead, it measures the percentage of adult residents with a high school diploma.[4]
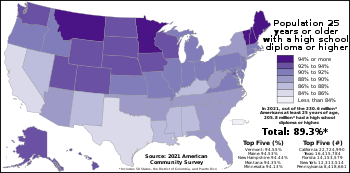
Overall, 89.3% of Americans over the age of 25 had graduated from high school in 2021, with the highest level found in the state of 佛蒙特州 at 94.5% and the lowest in the state of 加利福尼亞州 at 84.4%. In 波多黎各, the proportion was even lower, though, at 79.6%.[1]
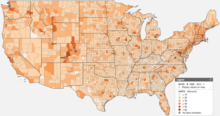
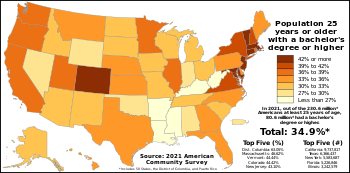
34.9% of Americans over the age of 25 had educational attainment of having a bachelor's degree or higher in 2019. The state with the highest percentage of people having a bachelor's degree or higher educational attainment was 麻薩諸塞州 at 46.6%, and the lowest was 西維吉尼亞州 at 24.1%. The 華盛頓哥倫比亞特區 had a percentage significantly higher than that of any U.S. state at 63.0%.[1]
Advanced Degrees, such as 碩士 and 博士 were held by 13.7% of Americans at least 25 years old in 2019. Advanced Degrees were most common in 麻薩諸塞州, with 21.3% of Massachusetts residents holding an advanced degree of any type in 2019, and they were least common in 密西西比州, with 9.3% of Mississippi residents holding an advanced degree. The 華盛頓哥倫比亞特區 had a percentage of 37.8%, higher than that of any state, while in the Commonwealth of 波多黎各, 7.9% of Americans had an advanced degree, a proportion lower than any state in the U.S.[1]
As of the 2010 Census, four 美國領地 (美屬薩摩亞, 關島, the 北馬里亞納群島, and the 美屬維京群島) had educational attainment numbers below every U.S. state (and the 華盛頓哥倫比亞特區). In the U.S. Virgin Islands, 68.9% had attained a high school degree or higher; in American Samoa, 9.9% had attained a bachelor's degree or higher.[2][3]
列表
[編輯]下面列表可以找到美國每個州和領地達到特定教育水平的人口(25歲或以上人口),以及達到該教育水平的人口百分比。該列表按字母順序排序,可以單擊表格標題以按任何列排序。[1]
| 州或領地 | 25歲以上人口 | 擁有高中文憑 | 擁有學士學位 | 擁有研究生學位 | |||
|---|---|---|---|---|---|---|---|
| 成人 | 比率 | 成人 | 比率 | 成人 | 比率 | ||
| 3,451,208 | 3,034,741 | 87.93% | 946,766 | 27.43% | 374,490 | 10.85% | |
| 485,779 | 453,289 | 93.31% | 159,290 | 32.79% | 57,868 | 11.91% | |
| 4,980,297 | 4,430,934 | 88.97% | 1,615,081 | 32.43% | 629,408 | 12.64% | |
| 2,037,763 | 1,806,873 | 88.67% | 515,034 | 25.27% | 190,897 | 9.37% | |
| 26,909,869 | 22,724,990 | 84.45% | 9,737,817 | 36.19% | 3,779,787 | 14.05% | |
| 4,044,182 | 3,738,208 | 92.43% | 1,796,240 | 44.42% | 688,931 | 17.04% | |
| 2,534,376 | 2,309,185 | 91.11% | 1,067,671 | 42.13% | 479,981 | 18.94% | |
| 711,104 | 649,638 | 91.36% | 253,292 | 35.62% | 106,997 | 15.05% | |
| 478,774 | 444,233 | 92.79% | 301,852 | 63.05% | 181,081 | 37.82% | |
| 15,762,122 | 14,153,579 | 89.79% | 5,226,846 | 33.16% | 1,978,625 | 12.55% | |
| 7,234,271 | 6,436,394 | 88.97% | 2,505,076 | 34.63% | 991,062 | 13.70% | |
| 1,021,687 | 949,476 | 92.93% | 360,681 | 35.30% | 133,832 | 13.10% | |
| 1,257,566 | 1,147,653 | 91.26% | 386,264 | 30.72% | 132,502 | 10.54% | |
| 8,730,697 | 7,872,693 | 90.17% | 3,242,579 | 37.14% | 1,310,297 | 15.01% | |
| 4,559,631 | 4,132,897 | 90.64% | 1,316,787 | 28.88% | 473,718 | 10.39% | |
| 2,137,261 | 1,994,595 | 93.32% | 652,742 | 30.54% | 210,864 | 9.87% | |
| 1,942,133 | 1,784,711 | 91.89% | 687,452 | 35.40% | 259,988 | 13.39% | |
| 3,077,867 | 2,708,147 | 87.99% | 830,414 | 26.98% | 341,868 | 11.11% | |
| 3,117,186 | 2,701,889 | 86.68% | 824,369 | 26.45% | 300,894 | 9.65% | |
| 1,015,078 | 959,533 | 94.53% | 365,305 | 35.99% | 140,318 | 13.82% | |
| 4,273,260 | 3,892,442 | 91.09% | 1,818,202 | 42.55% | 861,669 | 20.16% | |
| 4,934,755 | 4,495,563 | 91.10% | 2,300,423 | 46.62% | 1,049,675 | 21.27% | |
| 6,971,895 | 6,411,597 | 91.96% | 2,208,170 | 31.67% | 870,008 | 12.48% | |
| 3,898,742 | 3,669,895 | 94.13% | 1,516,426 | 38.90% | 522,543 | 13.40% | |
| 1,968,167 | 1,702,178 | 86.49% | 487,663 | 24.78% | 184,007 | 9.35% | |
| 4,226,634 | 3,871,249 | 91.59% | 1,340,643 | 31.72% | 517,428 | 12.24% | |
| 766,758 | 723,450 | 94.35% | 266,820 | 34.80% | 95,443 | 12.45% | |
| 1,292,536 | 1,191,221 | 92.16% | 445,261 | 34.45% | 158,751 | 12.28% | |
| 2,192,826 | 1,911,173 | 87.16% | 604,626 | 27.57% | 211,418 | 9.64% | |
| 1,008,318 | 952,238 | 94.44% | 405,815 | 40.25% | 158,459 | 15.72% | |
| 6,474,427 | 5,890,494 | 90.98% | 2,790,646 | 43.10% | 1,126,293 | 17.40% | |
| 1,450,549 | 1,268,955 | 87.48% | 435,930 | 30.05% | 204,185 | 14.08% | |
| 13,987,094 | 12,313,514 | 88.03% | 5,583,687 | 39.92% | 2,477,848 | 17.72% | |
| 7,245,632 | 6,499,145 | 89.70% | 2,529,657 | 34.91% | 955,976 | 13.19% | |
| 506,739 | 474,432 | 93.62% | 160,847 | 31.74% | 47,533 | 9.38% | |
| 8,117,973 | 7,447,659 | 91.74% | 2,493,910 | 30.72% | 957,286 | 11.79% | |
| 2,639,889 | 2,341,875 | 88.71% | 737,183 | 27.92% | 254,015 | 9.62% | |
| 3,030,635 | 2,784,373 | 91.87% | 1,101,061 | 36.33% | 420,755 | 13.88% | |
| 9,161,945 | 8,418,661 | 91.89% | 3,164,985 | 34.54% | 1,277,263 | 13.94% | |
| 2,401,409 | 1,912,629 | 79.65% | 683,894 | 28.48% | 190,538 | 7.93% | |
| 773,464 | 689,448 | 89.14% | 282,326 | 36.50% | 120,732 | 15.61% | |
| 3,598,398 | 3,224,401 | 89.61% | 1,134,636 | 31.53% | 429,896 | 11.95% | |
| 590,377 | 549,364 | 93.05% | 186,946 | 31.67% | 59,688 | 10.11% | |
| 4,814,533 | 4,320,485 | 89.74% | 1,467,481 | 30.48% | 543,077 | 11.28% | |
| 19,224,688 | 16,415,784 | 85.39% | 6,366,437 | 33.12% | 2,288,616 | 11.90% | |
| 2,010,727 | 1,873,479 | 93.17% | 740,097 | 36.81% | 255,215 | 12.69% | |
| 462,705 | 437,478 | 94.55% | 205,621 | 44.44% | 85,248 | 18.42% | |
| 5,942,672 | 5,430,700 | 91.38% | 2,484,460 | 41.81% | 1,089,585 | 18.33% | |
| 5,401,149 | 4,987,844 | 92.35% | 2,104,662 | 38.97% | 817,197 | 15.13% | |
| 1,265,439 | 1,123,971 | 88.82% | 305,188 | 24.12% | 125,812 | 9.94% | |
| 4,076,339 | 3,804,265 | 93.33% | 1,326,478 | 32.54% | 450,011 | 11.04% | |
| 395,348 | 369,992 | 93.59% | 115,618 | 29.24% | 42,363 | 10.72% | |
| 230,594,873 | 205,833,612 | 89.26% | 80,587,357 | 34.95% | 31,611,941 | 13.71% | |
美國領土
[編輯]Below is a table of the educational attainment of four U.S. territories (美屬薩摩亞, 關島, the 北馬里亞納群島, and the 美屬維京群島.[2][3] The data in the table below is from the 2010 Census because these territories are not included in the American Community Survey. 波多黎各 is not included in this table because Puerto Rico is included in the American Community Survey (with the name "Puerto Rico Community Survey")[5] — Puerto Rico is included in the table above.
The data below is for people 25 years and older.
| 領土 | 高中畢業比率 (2010年人口普查) |
學士學位比率 (2010年人口普查) |
高等學位比率 (2010年人口普查) |
總人數 (2010年人口普查) |
高中畢業人數 (2010年人口普查) |
學士學位人數 (2010年人口普查) |
高等學位人數 (2010年人口普查) |
|---|---|---|---|---|---|---|---|
| 82.1% | 9.9% | 3.5% | 25,907 | 21,265 | 4,940 | 906 | |
| 79.4% | 20.4% | 5.2% | 89,253 | 70,905 | 18,179 | 4,666 | |
| 82.4% | 20.2% | 3.7% | 32,602 | 26,865 | 6,585 | 1,202 | |
| 68.9% | 19.2% | 7.4% | 70,813 | 48,791 | 5,450 | 5,229 |
圖
[編輯]


參見
[編輯]參考
[編輯]- ^ 1.0 1.1 1.2 1.3 1.4 EDUCATIONAL ATTAINMENT. U.S. Census Bureau. [18 September 2022]. (原始內容存檔於18 September 2022).
- ^ 2.0 2.1 2.2 SEX BY EDUCATIONAL ATTAINMENT FOR THE POPULATION 25 YEARS AND OVER in Guam. data.census.gov. [21 July 2022]. (原始內容存檔於2022-12-22).
- ^ 3.0 3.1 3.2 SEX BY EDUCATIONAL ATTAINMENT FOR THE POPULATION 25 YEARS AND OVER in Virgin Islands. data.census.gov. [21 July 2022]. (原始內容存檔於2022-12-22).
- ^ Bureau, US Census. American Community Survey (ACS). Census.gov. [23 December 2022]. (原始內容存檔於2021-12-05).
- ^ Bureau, US Census. About the Puerto Rico Community Survey. Census.gov. [15 July 2022]. (原始內容存檔於2023-05-25).

