
File:Spectral effects of decimation compared on 3 popular frequency scale conventions.pdf

此PDF文件的JPG预览的大小:720 × 600像素。 其他分辨率:288 × 240像素 | 576 × 480像素 | 922 × 768像素 | 1,229 × 1,024像素 | 1,800 × 1,500像素。
原始文件 (1,800 × 1,500像素,文件大小:26 KB,MIME类型:application/pdf)
摘要
| 描述 |
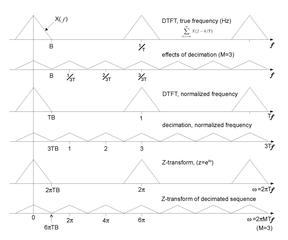
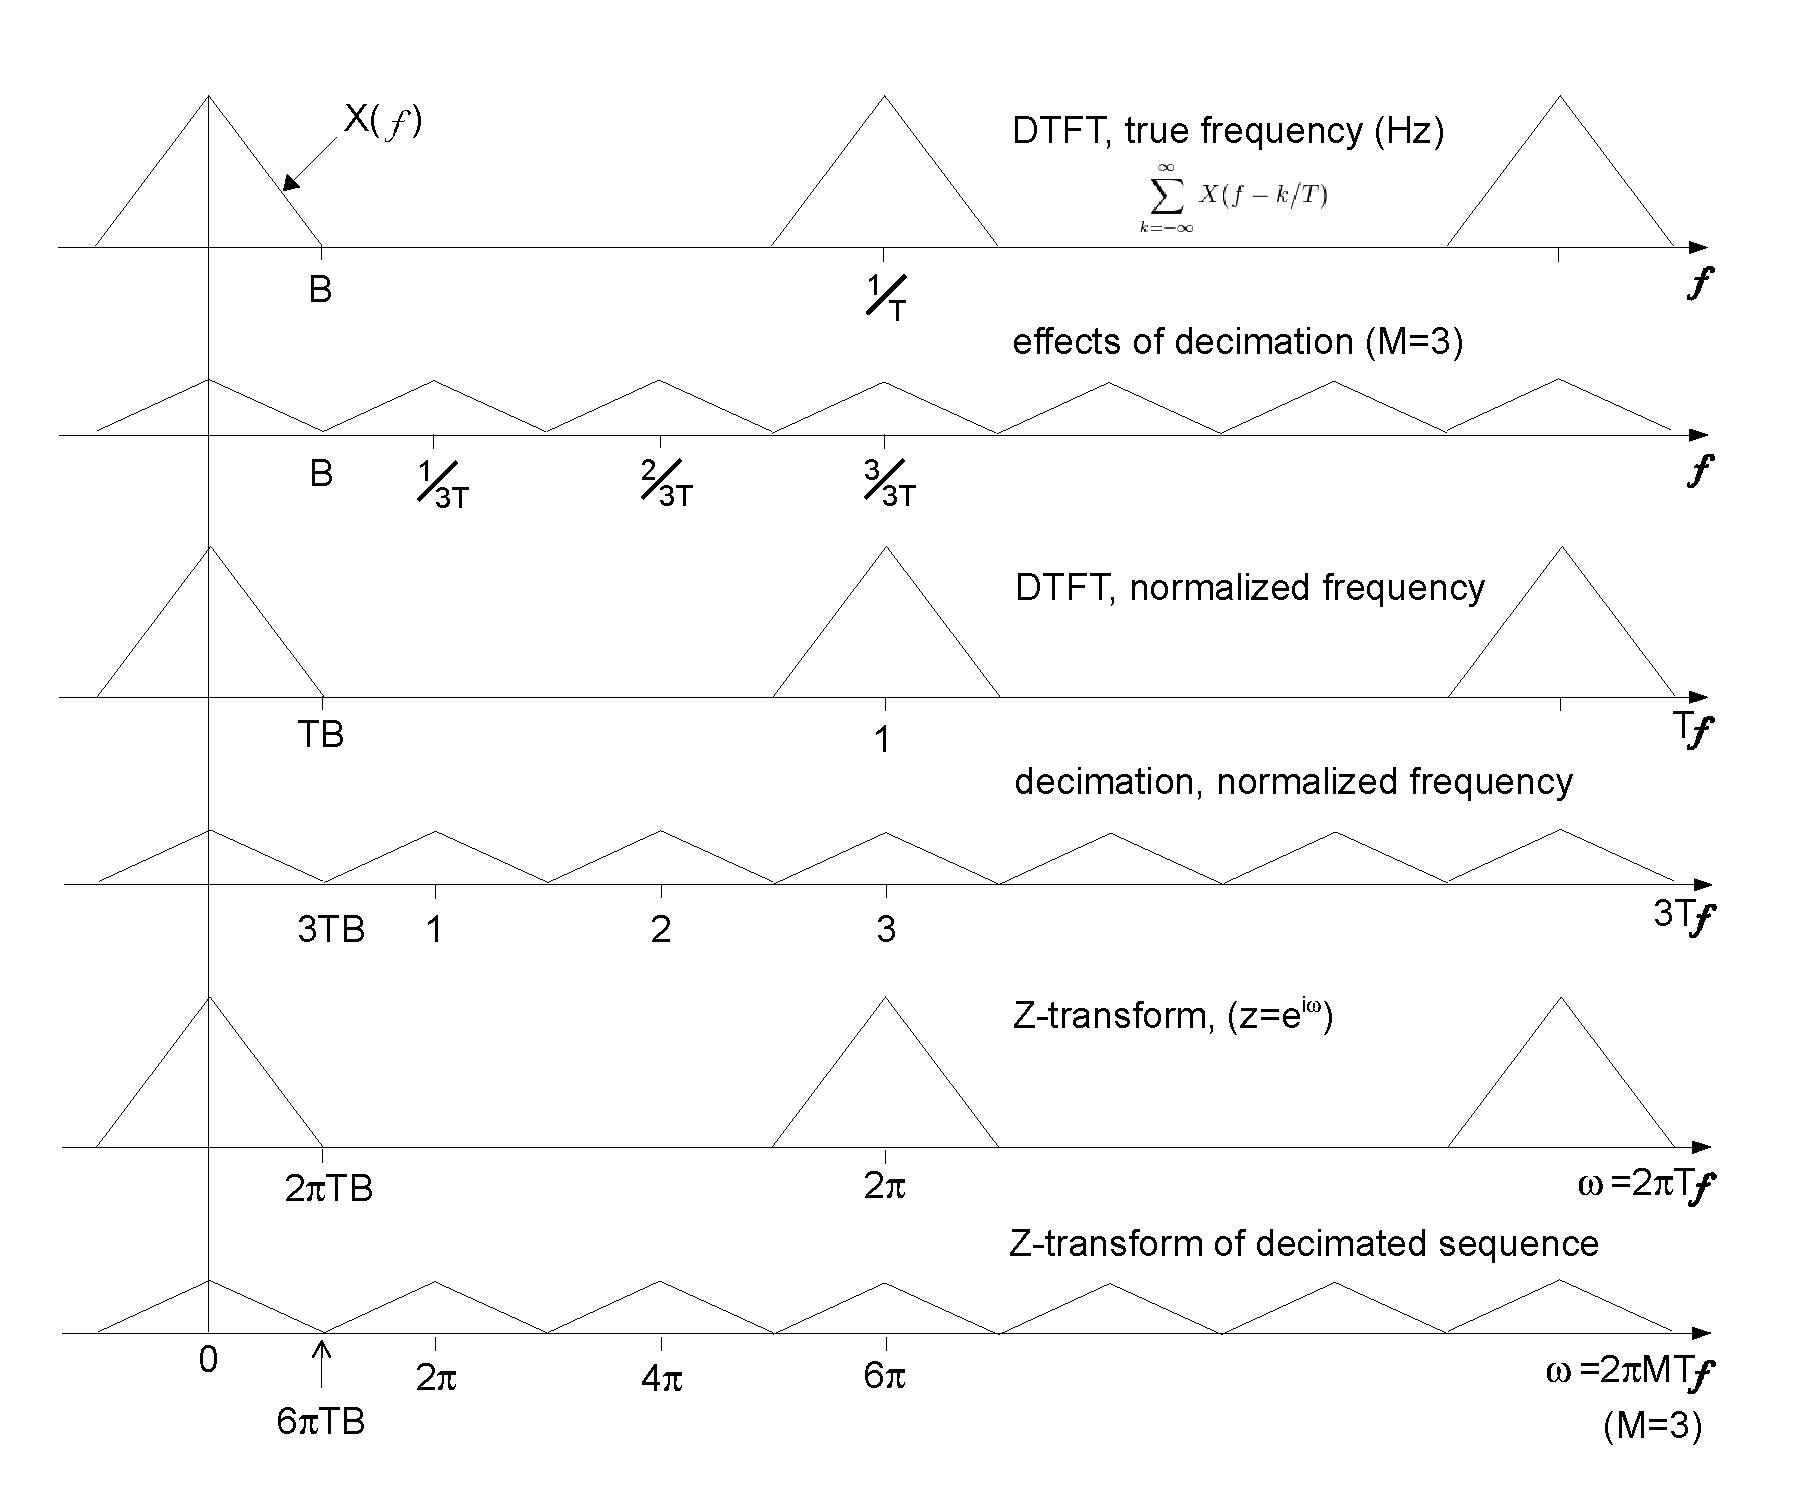
English: Each of 3 pairs of graphs depicts the spectral distributions of an oversampled function and the same function sampled at 1/3 the original rate. The bandwidth, B, in this example is just small enough that the slower sampling does not cause overlap (aliasing). The top pair of graphs represent the discrete-time Fourier transform (DTFT) representation. The middle pair, depict a normalized frequency scale, preferred by many filter design programs. The frequency, f, in Hz is divided by the sample-rate. The periodicity and Nyquist frequency are then represented by constants, 1 and 1/2 respectively. The bottom pair depict a different normalized frequency scale, used by the Z-transform... the periodicity and Nyquist frequency are respectively represented by 2π and π. |
|||
| 日期 | ||||
| 来源 | 自己的作品. The first two graphs correspond to the top and bottom graphs of Harris[1], Figure 2.10 | |||
| 作者 | Bob K | |||
| 授权 (二次使用本文件) |
我,本作品著作权人,特此采用以下许可协议发表本作品:
|
|||
| 其他版本 | 此文件衍生的作品: Spectral effects of decimation.pdf | |||
| References |
|
文件历史
点击某个日期/时间查看对应时刻的文件。
| 日期/时间 | 缩略图 | 大小 | 用户 | 备注 | |
|---|---|---|---|---|---|
| 当前 | 2014年1月19日 (日) 16:34 |  | 1,800 × 1,500(26 KB) | Bob K | rescale 4th graph |
| 2014年1月19日 (日) 15:52 | 没有缩略图 | 0 × 0(26 KB) | Bob K | User created page with UploadWizard |
文件用途
以下页面使用本文件:
全域文件用途
以下其他wiki使用此文件:
- sr.wikipedia.org上的用途