
File:High plains fresh groundwater usage 2000.svg

原始檔案 (SVG 檔案,表面大小:747 × 946 像素,檔案大小:1.48 MB)
摘要
| 描述 |
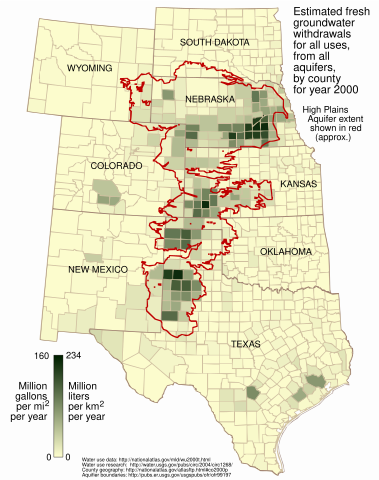
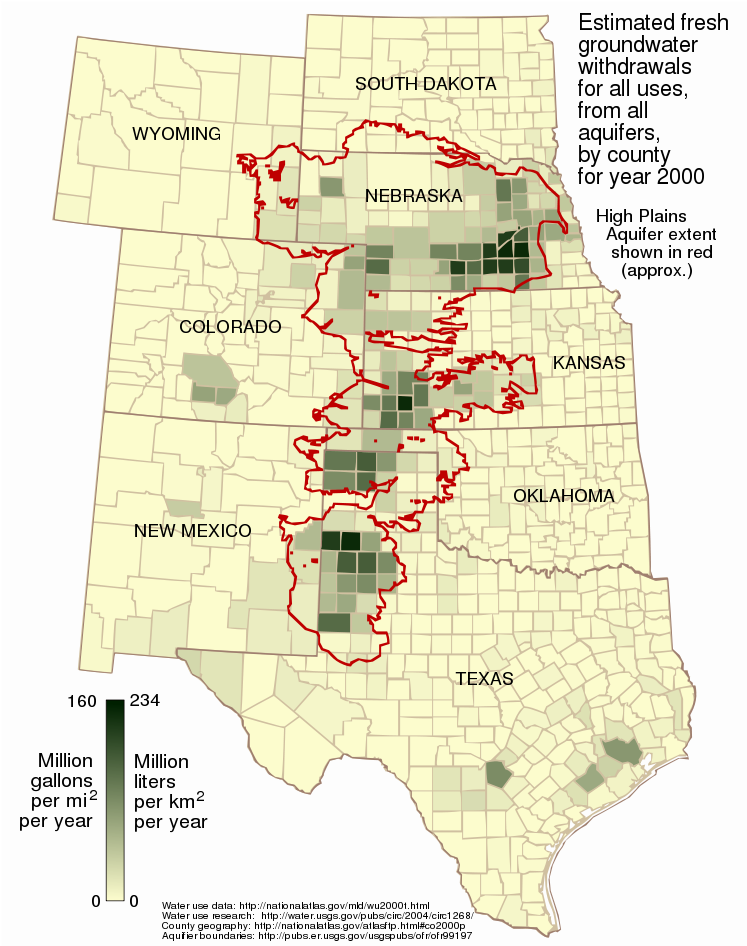
English: This map shows the estimated fresh water usage per square mile in the year 2000 for counties in the eight states underlain in part by the High Plains (Ogallala) Aquifer, presented as million gallons per square mile and million liters per square kilometer.
Usage is for all purposes -- public supply, industrial, irrigation, mining, livestock, and thermoelectric power -- from all underground sources, not just from the Ogallala Aquifer. Water usage data for the year 2000 was taken from the datafile wu2000t.dbf[1] from the US National Atlas[2]. Citation information from the metadata for that file:
Additionally:
The attribute used in this map is described:
The data is supplied as million gallons per day, by county. To arrive at an annual amount per square mile per year, the usage value from wu2000t.dbf was multiplied by 365 and divided by the number of square miles in the county as given in the 2000 county shapefile co2000p020 from the National Atlas:
Aquifer boundaries taken from Fischer and McGuire[3]. The map is presented in a Lambert azimuthal equal-area projection as used in the National Atlas (EPSG:2163[4]), the central meridian and latitude of which align nicely with the aquifer. |
| 日期 | |
| 來源 | 自己的作品 |
| 作者 | Kbh3rd |
| 其他版本 | File:Ogallala area freshwater ground withdrawals all aquifers.png |
授權條款
- 您可以自由:
- 分享 – 複製、發佈和傳播本作品
- 重新修改 – 創作演繹作品
- 惟需遵照下列條件:
- 姓名標示 – 您必須指名出正確的製作者,和提供授權條款的連結,以及表示是否有對內容上做出變更。您可以用任何合理的方式來行動,但不得以任何方式表明授權條款是對您許可或是由您所使用。
- 相同方式分享 – 如果您利用本素材進行再混合、轉換或創作,您必須基於如同原先的相同或兼容的條款,來分布您的貢獻成品。
檔案歷史
點選日期/時間以檢視該時間的檔案版本。
| 日期/時間 | 縮圖 | 尺寸 | 使用者 | 備註 | |
|---|---|---|---|---|---|
| 目前 | 2009年3月9日 (一) 23:13 | | 747 × 946(1.48 MB) | Kbh3rd | corrected metric conversion - see talk |
| 2009年3月3日 (二) 01:28 |  | 747 × 946(1.48 MB) | Kbh3rd | The map said "acre" while the data, as noted on the image description page, correctly said "square mile". I have fixed that and made some minor esthetic adjustments of the state name locations. | |
| 2009年3月2日 (一) 23:40 |  | 747 × 946(1.48 MB) | Kbh3rd | {{Information |Description={{en|1=This map shows the estimated fresh water usage per square mile in the year 2000 for counties in the eight states underlain in part by the High Plains (Ogallala) Aquifer, presented as million milli |
檔案用途
下列頁面有用到此檔案:
全域檔案使用狀況
以下其他 wiki 使用了這個檔案:
- ar.wikipedia.org 的使用狀況
- ca.wikipedia.org 的使用狀況
- ckb.wikipedia.org 的使用狀況
- en.wikipedia.org 的使用狀況
- fy.wikipedia.org 的使用狀況
- kk.wikipedia.org 的使用狀況
- kw.wikipedia.org 的使用狀況
- ml.wikipedia.org 的使用狀況
- pt.wikipedia.org 的使用狀況
- sr.wikipedia.org 的使用狀況
- vi.wikipedia.org 的使用狀況
- www.wikidata.org 的使用狀況