
File:Spherical harmonics positive negative.svg

此 SVG 檔案的 PNG 預覽的大小:265 × 251 像素。 其他解析度:253 × 240 像素 | 507 × 480 像素 | 811 × 768 像素 | 1,081 × 1,024 像素 | 2,162 × 2,048 像素。
原始檔案 (SVG 檔案,表面大小:265 × 251 像素,檔案大小:22 KB)
摘要
| 描述 |
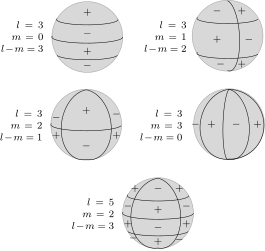
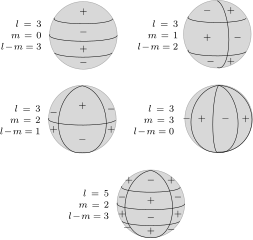
English: Representation of a spherical harmonic by discrepancy to a sphere. |
| 日期 | |
| 來源 | 自己的作品 |
| 作者 | Krishnavedala |
W3C-validity not checked.
| LaTeX source code |
|---|
\documentclass[12pt,border=1pt,tikz,class=scrartcl]{standalone}
\usepackage[T1]{fontenc}
\usepackage[utf8]{inputenc}
\usepackage{lmodern}
\usepackage{mathtools}

\usepackage{tikz-3dplot}
\usetikzlibrary{arrows,shapes,calc,positioning,matrix,fit}

\begin{document}
\scriptsize
\tdplotsetmaincoords{100}{170}
\begin{tikzpicture}[very thick,auto,
	info box/.style={align=right, text width=4em}]
	\node at (0,0) (p1) {\begin{tikzpicture}
		\draw[tdplot_screen_coords, fill=white!70!gray] (0,0) circle (1);
		\tdplotsinandcos {\sintheta}{\costheta}{0}
		\tdplotdrawarc {(0,0,-\sintheta)} {\costheta} {0} {-190} {} {}
		\tdplotsinandcos {\sintheta}{\costheta}{-30}
		\tdplotdrawarc {(0,0,-\sintheta)} {\costheta} {0} {-190} {} {}
		\tdplotsinandcos {\sintheta}{\costheta}{30}
		\tdplotdrawarc {(0,0,-\sintheta)} {\costheta} {-20} {-180} {} {}
		\node at (0,.7) {$+$};		\node at (0,.1) {$-$};
		\node at (0,-.4) {$+$};	\node at (0,-.8) {$-$};
	\end{tikzpicture}
	};
	\node [left=-.3em of p1,info box] {$l=3$\\$m=0$\\$l-m=3$};
	\node at (4,0) (p2) {\begin{tikzpicture}
		\draw[tdplot_screen_coords, fill=white!70!gray] (0,0) circle (1);
		\tdplotsinandcos {\sintheta}{\costheta}{-30}
		\tdplotdrawarc {(0,0,-\sintheta)} {\costheta} {0} {-180} {} {}
		\tdplotsinandcos {\sintheta}{\costheta}{30}
		\tdplotdrawarc {(0,0,-\sintheta)} {\costheta} {0} {-180} {} {}
		\tdplotsetthetaplanecoords{60}\tdplotdrawarc [tdplot_rotated_coords] {(0,0,0)} {1} {-180} {0} {} {}
		\node at (.4,.7) {$+$};	\node at (-.3,.7) {$-$};
		\node at (.6,-.1) {$-$};	\node at (-.3,-.1) {$+$};
		\node at (.4,-.8) {$+$};	\node at (-.2,-.8) {$-$};
	\end{tikzpicture}
	};
	\node [left=-.3em of p2,info box] {$l=3$\\$m=1$\\$l-m=2$};
	\node at (0,-2.5) (p3) {\begin{tikzpicture}
		\draw[tdplot_screen_coords, fill=white!70!gray] (0,0) circle (1);
		\tdplotsinandcos {\sintheta}{\costheta}{0}
		\tdplotdrawarc {(0,0,-\sintheta)} {\costheta} {0} {-180} {} {}
		\tdplotsetthetaplanecoords{35}\tdplotdrawarc [tdplot_rotated_coords] {(0,0,0)} {1} {0} {-180} {} {}
		\tdplotsetthetaplanecoords{125}\tdplotdrawarc [tdplot_rotated_coords] {(0,0,0)} {1} {0} {-180} {} {}
		\node at (-.85,.2) {$-$};	\node at (0,.4) {$+$};		\node at (.85,.3) {$-$};
		\node at (-.85,-.3) {$+$};		\node at (0,-.6) {$-$};		\node at (.85,-.3) {$+$};
	\end{tikzpicture}
	};
	\node [left=-.3em of p3,info box] {$l=3$\\$m=2$\\$l-m=1$};
	\node at (4,-2.5) (p4) {\begin{tikzpicture}
		\draw[tdplot_screen_coords, fill=white!70!gray] (0,0) circle (1);
		\tdplotsetthetaplanecoords{0}\tdplotdrawarc [tdplot_rotated_coords] {(0,0,0)} {1} {0} {-180} {} {}
		\tdplotsetthetaplanecoords{45}\tdplotdrawarc [tdplot_rotated_coords] {(0,0,0)} {1} {0} {-180} {} {}
		\tdplotsetthetaplanecoords{90}\tdplotdrawarc [tdplot_rotated_coords] {(0,0,0)} {1} {0} {-180} {} {}
		\tdplotsetthetaplanecoords{135}\tdplotdrawarc [tdplot_rotated_coords] {(0,0,0)} {1} {0} {-180} {} {}
		\node at (-.95,0) {$-$};	\node at (-.5,0) {$+$};
		\node at (.2,0) {$-$};		\node at (.8,0) {$+$};
	\end{tikzpicture}
	};
	\node [left=-.3em of p4,info box] {$l=3$\\$m=3$\\$l-m=0$};
	\node at (2,-5) (p5) {\begin{tikzpicture}
		\draw[tdplot_screen_coords, fill=white!70!gray] (0,0) circle (1);
		\tdplotsinandcos {\sintheta}{\costheta}{0}
		\tdplotdrawarc {(0,0,-\sintheta)} {\costheta} {0} {-190} {} {}
		\tdplotsinandcos {\sintheta}{\costheta}{-30}
		\tdplotdrawarc {(0,0,-\sintheta)} {\costheta} {0} {-190} {} {}
		\tdplotsinandcos {\sintheta}{\costheta}{30}
		\tdplotdrawarc {(0,0,-\sintheta)} {\costheta} {-20} {-180} {} {}
		\tdplotsetthetaplanecoords{40}\tdplotdrawarc [tdplot_rotated_coords] {(0,0,0)} {1} {0} {-180} {} {}
		\tdplotsetthetaplanecoords{130}\tdplotdrawarc [tdplot_rotated_coords] {(0,0,0)} {1} {0} {-180} {} {}
		\node at (-.65,.7) {$+$};	\node at (0,.7) {$-$};	\node at (.6,.7) {$+$};
		\node at (-.85,.2) {$-$};	\node at (0,.1) {$+$};	\node at (.8,.2) {$-$};
		\node at (-.7,-.7) {$-$};	\node at (0,-.8) {$+$};	\node at (.6,-.75) {$-$};
		\node at (-.85,-.3) {$+$};	\node at (0,-.4) {$-$};	\node at (.8,-.3) {$+$};
	\end{tikzpicture}
	};
	\node [left=-.3em of p5,info box] {$l=5$\\$m=2$\\$l-m=3$};
\end{tikzpicture}
\end{document}
|
授權條款
我,本作品的著作權持有者,決定用以下授權條款發佈本作品:
此檔案採用創用CC 姓名標示-相同方式分享 4.0 國際授權條款。
- 您可以自由:
- 分享 – 複製、發佈和傳播本作品
- 重新修改 – 創作演繹作品
- 惟需遵照下列條件:
- 姓名標示 – 您必須指名出正確的製作者,和提供授權條款的連結,以及表示是否有對內容上做出變更。您可以用任何合理的方式來行動,但不得以任何方式表明授權條款是對您許可或是由您所使用。
- 相同方式分享 – 如果您利用本素材進行再混合、轉換或創作,您必須基於如同原先的相同或兼容的條款,來分布您的貢獻成品。
檔案歷史
點選日期/時間以檢視該時間的檔案版本。
| 日期/時間 | 縮圖 | 尺寸 | 使用者 | 備註 | |
|---|---|---|---|---|---|
| 目前 | 2014年12月1日 (一) 23:43 | | 265 × 251(22 KB) | Krishnavedala | User created page with UploadWizard |
檔案用途
下列頁面有用到此檔案:
全域檔案使用狀況
以下其他 wiki 使用了這個檔案:
- de.wikipedia.org 的使用狀況
- en.wikipedia.org 的使用狀況
- pt.wikipedia.org 的使用狀況
- tr.wikipedia.org 的使用狀況
- vi.wikipedia.org 的使用狀況