
File:NSIDC arctic sea ice extent since 1979.svg

此 SVG 檔案的 PNG 預覽的大小:800 × 533 像素。 其他解析度:320 × 213 像素 | 640 × 427 像素 | 1,024 × 683 像素 | 1,280 × 853 像素 | 2,560 × 1,707 像素 | 810 × 540 像素。
原始檔案 (SVG 檔案,表面大小:810 × 540 像素,檔案大小:37 KB)
摘要
| 描述 |
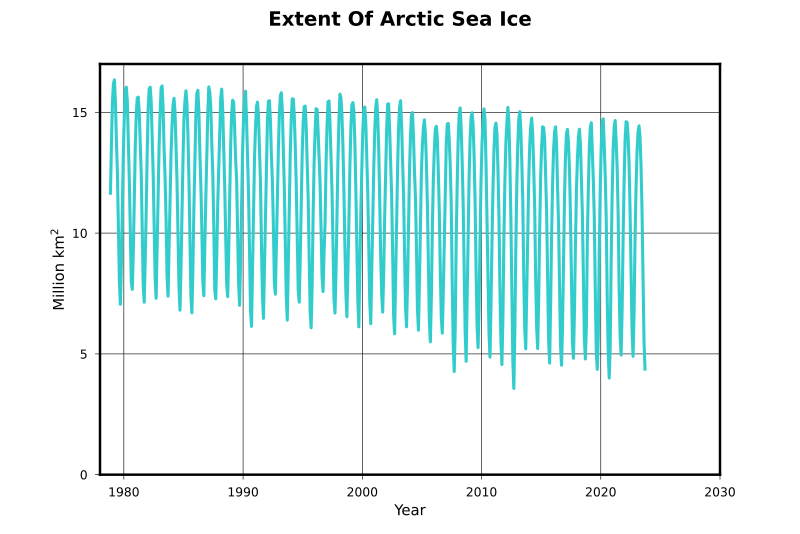
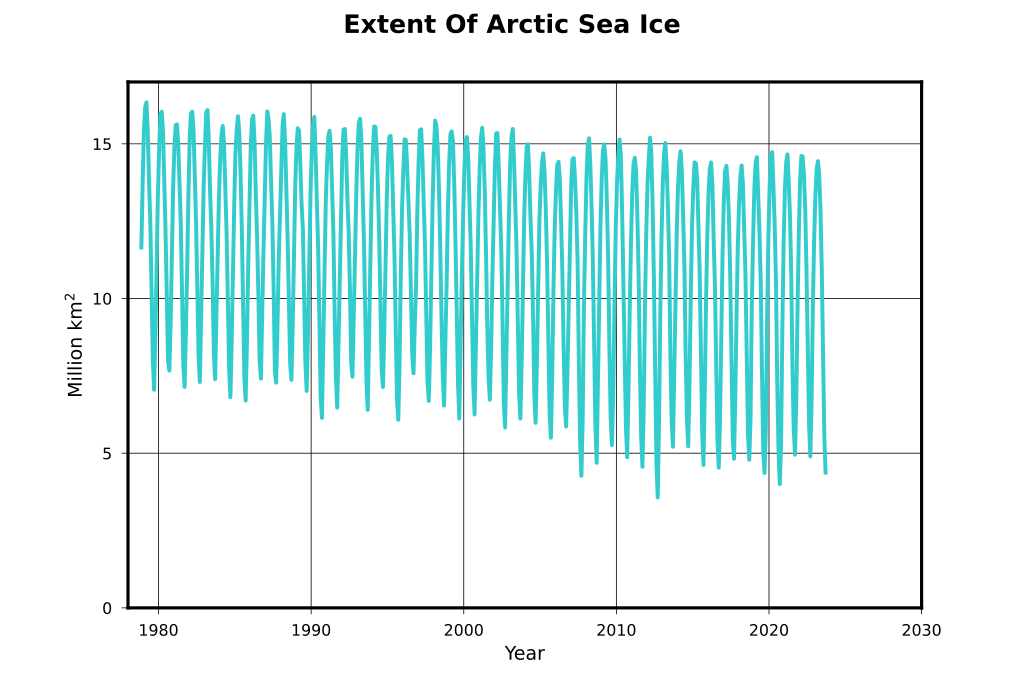
English: Plot of arctic sea ice extent development between 1979 and 2023 in monthly mean values. For the determination of the "area" value, every pixel with a sea ice concentration > .15 is taken. The pixel area is multiplied with the concentration value derived from the passive infrared signal. For the "extent" value, the concentration value is taken as 1, so we basically get full area with >.15 concentration.
Deutsch: Verlauf der Umrissfläche des arktischen Meereises in Monatsmittelwerten von 1979 bis 2023. Für die "area"-Daten werden alle Pixel mit einer Eiskonzentration > 0.15 genommen und deren Fläche mit der Eiskonzentration multipliziert. Für die "extent"-Daten wird diese Eiskonzentration =1 gesetzt - so erhält man die Gesamtfläche mit überhaupt irgendwelchem Eis. |
| 日期 | |
| 來源 | 自己的作品 |
| 作者 | Dominiklenne |
Data source: Fetterer, F., K. Knowles, W. Meier, and M. Savoie. 2002, updated until 2010. Sea Ice Index. Boulder, Colorado USA: National Snow and Ice Data Center. Digital media. ftp://sidads.colorado.edu/DATASETS/NOAA/G02135/. Corresponding website: http://nsidc.org/data/seaice_index/archives/index.html
For the area definition see: https://nsidc.org/learn/ask-scientist/what-difference-between-sea-ice-area-and-extent
授權條款
| 我,此作品的版權所有人,釋出此作品至公共領域。此授權條款在全世界均適用。 這可能在某些國家不合法,如果是的話: 我授予任何人有權利使用此作品於任何用途,除受法律約束外,不受任何限制。 |
檔案歷史
點選日期/時間以檢視該時間的檔案版本。
| 日期/時間 | 縮圖 | 尺寸 | 使用者 | 備註 | |
|---|---|---|---|---|---|
| 目前 | 2023年10月23日 (一) 17:48 | | 810 × 540(37 KB) | Dominiklenne | update to october 2023 |
| 2023年5月9日 (二) 21:07 |  | 810 × 540(37 KB) | Dominiklenne | update to april 2023 | |
| 2022年3月4日 (五) 19:12 |  | 810 × 540(36 KB) | Dominiklenne | update until february 2022 | |
| 2020年11月7日 (六) 00:39 |  | 810 × 540(42 KB) | Dominiklenne | update until october 2020 | |
| 2019年10月27日 (日) 17:16 |  | 810 × 540(45 KB) | Dominiklenne | data added until september 2019, year scale extended to 2030 | |
| 2018年10月30日 (二) 22:35 |  | 810 × 540(47 KB) | Dominiklenne | data updated until september 2018 | |
| 2017年7月8日 (六) 22:44 |  | 810 × 540(47 KB) | Dominiklenne | data updated until june 2017 | |
| 2016年7月22日 (五) 21:43 |  | 810 × 540(47 KB) | Dominiklenne | data updated until june 2016 | |
| 2015年8月27日 (四) 21:43 |  | 810 × 540(40 KB) | Dominiklenne | minor y scale change to the same as in https://commons.wikimedia.org/wiki/File:Plot_arctic_sea_ice_area.svg | |
| 2015年8月27日 (四) 17:03 |  | 810 × 540(40 KB) | Dominiklenne | update until 2015 / 07. Use of python matplotlip pyplot instead of Gnumeric. Slightly different y-scale for better exhaustion of plot area. |
檔案用途
下列頁面有用到此檔案:
全域檔案使用狀況
以下其他 wiki 使用了這個檔案:
- ar.wikipedia.org 的使用狀況
- bn.wikipedia.org 的使用狀況
- de.wikipedia.org 的使用狀況
- en.wikipedia.org 的使用狀況
- fa.wikipedia.org 的使用狀況
- fr.wikipedia.org 的使用狀況
- it.wikipedia.org 的使用狀況
- ko.wikipedia.org 的使用狀況
- la.wikipedia.org 的使用狀況
- mk.wikipedia.org 的使用狀況
- nn.wikipedia.org 的使用狀況
- no.wikipedia.org 的使用狀況
- sq.wikipedia.org 的使用狀況
- sv.wikipedia.org 的使用狀況
- uk.wikipedia.org 的使用狀況