
File:Ozone cfc trends.png
本预览的尺寸:517 × 600像素。 其他分辨率:207 × 240像素 | 414 × 480像素 | 662 × 768像素 | 1,096 × 1,271像素。
原始文件 (1,096 × 1,271像素,文件大小:123 KB,MIME类型:image/png)
摘要
| 描述 |
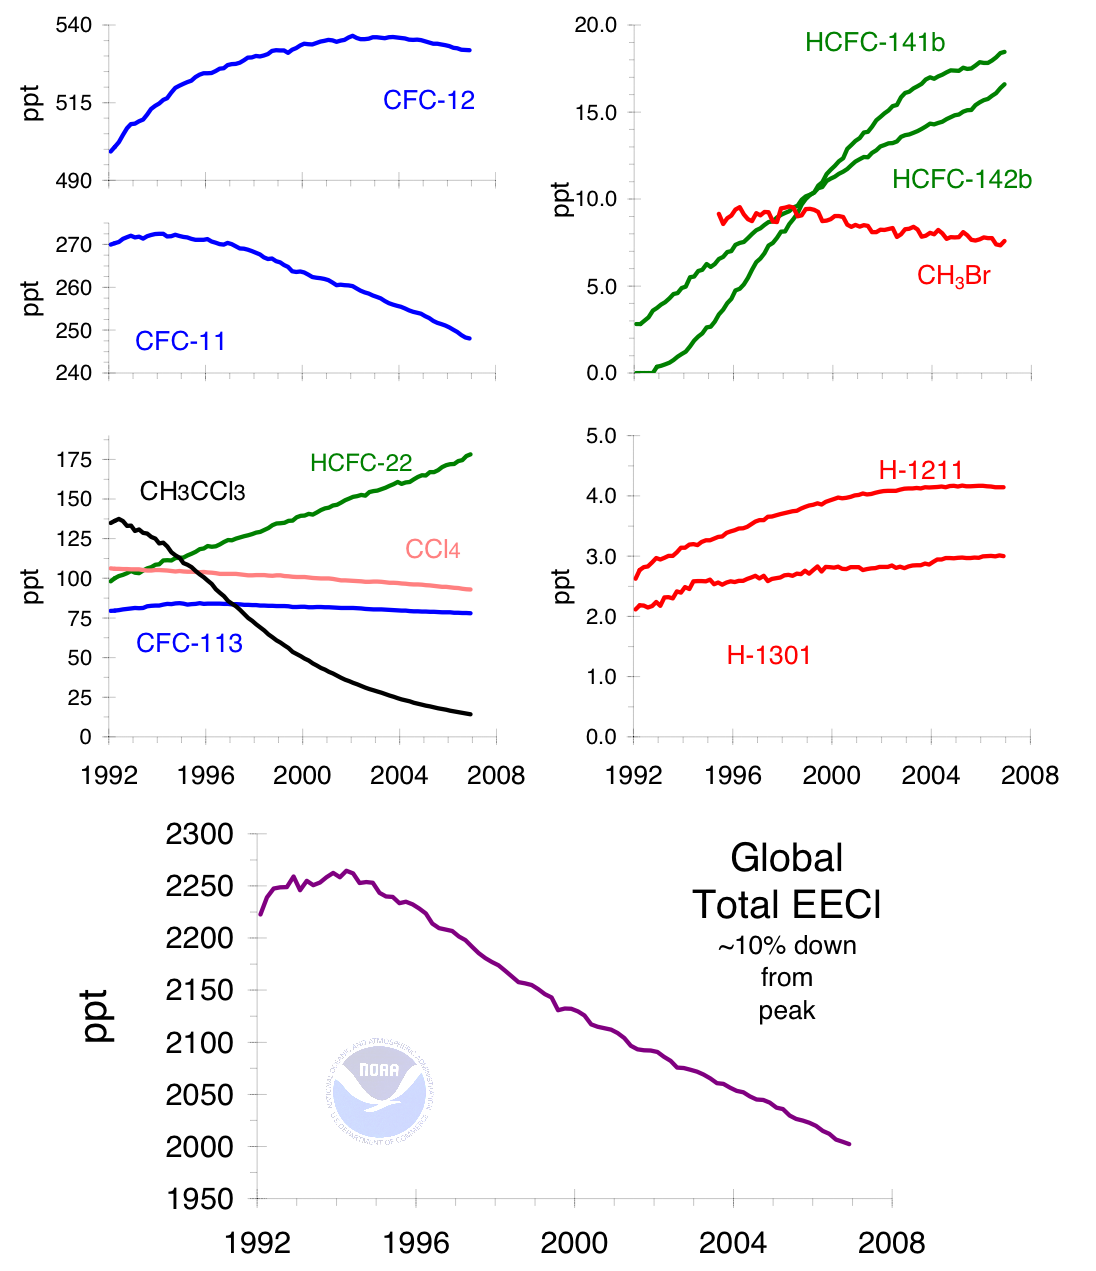
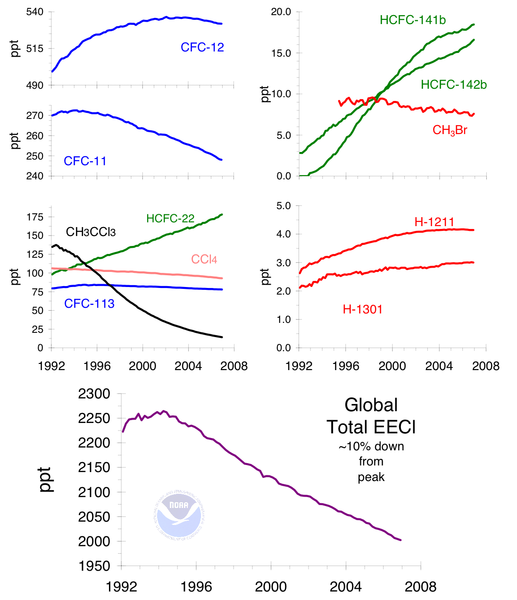
English: Ozone-depleting gas trends and equivalent chlorine effect. Combined chlorine and bromine in the lower atmosphere or troposphere from the most abundant chlorinated and brominated chemicals controlled by the Montreal Protocol. These changes are reflected in the upper atmosphere stratosphere (10-25 km), where most ozone loss occurs, with a delay (due to air transport) of 3-5 years. Bromine is included as an ozone-depleting chemical because although it is not as abundant as chlorine, it is 45 to 60 times more effective per atom in destroying stratospheric ozone. Earlier measurements showed that the peak of equivalent chlorine (chlorine + 45 (or 60) times bromine) occurred at the surface between mid-1992 and mid-1994.[1]
The observed decrease is driven by a large and rapid decline in methyl chloroform and methyl bromide, gases that are regulated internationally by the Montreal Protocol. The initial decline in methyl bromide was larger than that expected from projections given in the WMO/UNEP 2002 Scientific Assessment to Ozone Depletion.[2][3]
Français : Tendances pour les gaz appauvrissant la couche d'ozone (et effet en équivalent-chlore). Chlore et brome sont les halogènes destructeurs d'ozone les plus abondants, ils sont contrôlés par le Protocole de Montréal qui a permis leur réduction globale dans la haute atmosphère stratosphère (10-25 km), où la plupart de l'ozone se crée. Les effets apparaissent avec un retard de 3 à 5 ans (dû au transport aérien des CFC). Le brome est bien moins abondant que le chlore, mais il est 45 à 60 fois plus efficace par atome pour détruire l'ozone stratosphérique. Des mesures antérieures ont montré que le pic en «équivalent-chlore» (chlore + 45 (ou 60) fois brome) s'est produit à la surface entre mi-1992 et mi-1994 [1]. La diminution observée est due à une baisse importante et rapide du chloroforme de méthyle et du bromure de méthyle, pesticide et biocide gazeux réglementés mondialement par le Protocole de Montréal|Protocole de Montréal. La baisse initiale du bromure de méthyle a été plus importante qu'attendue par les projections de l’évaluation scientifique OMM / PNUE de 2002 sur l’appauvrissement de la couche d’ozone. [2] [3] |
| 来源 |
本檔案是由Maksim從en.wikipedia轉移到維基共享資源。 ftp://140.172.192.211/hats/Total_Cl_Br/totCl_2004.ps from CMDL Data Archive: http://www.cmdl.noaa.gov/info/ftpdata.html |
| 作者 | |
| 其他版本 |
|


|
此graph图片可使用矢量图形重新创建为SVG文件。这具有很多好处;更多信息请参见共享资源:待清理媒体。如果存在此图片的SVG格式,请将其上传,然后将此模板替换为
{{vector version available|新图片名称}}。
建议您将SVG命名为“Ozone cfc trends.svg”,这样在使用Vector version available(或Vva)模板时就不需要填写新图片名称参数。 |
许可协议
本图像属于公有领域,因该作品最初来自于美国国家海洋和大气管理局职员的职务作品。
|
References
- ↑ a b News Release Feb 6, 2001. Climate Monitoring and Data Laboratory (March 17). Archived from the original on 2006-09-29. Retrieved on 2006-01-15.
- ↑ a b CMDL Scientists find that ozone-depleting bromine is now on the decline. Climate Monitoring and Data Laboratory (June 9). Archived from the original on 2006-09-29. Retrieved on 2006-01-15.
- ↑ a b Halocarbons and other Atmospheric Trace Species. Climate Monitoring and Data Laboratory Summary Report #27 (March 17). Archived from the original on 2007-02-21. Retrieved on 2006-01-15.
Original edit history
原始描述頁面位於這裡。下列使用者名稱均來自en.wikipedia。
| 日期/时间 | 用户 | 备注 |
|---|---|---|
| 2005年6月9日, 20:44 | en:User:SEWilco | /* References */ more complete version |
| 2005年4月2日, 21:16 | en:User:SEWilco | link to 3rd reference |
| 2005年4月2日, 15:34 | en:User:Mozzerati | /* References */ make into numbered list, but what's the last reference? It's not used? See [[Wikipedia:Footnote3]] |
| 2005年4月2日, 15:33 | en:User:Mozzerati | update {{endnote| template to be {{note| according to recent consensus. See [[Wikipedia:Footnote3]] and talk page. |
| 2005年3月18日, 06:32 | en:User:SEWilco | updates |
| 3005年3月18日, 05:33 | en:User:SEWilco | updates |
| 2005年3月18日, 05:11 | en:User:SEWilco | CFC gas trends. ==Related images== <gallery> Image:Major greenhouse gas trends.png|Greenhouse gas trends </gallery> ==Source== {{PD-USGov-DOC-NOAA}} Source: http://www.cmdl.noaa.gov/hats/graphs/graphs.html or ftp://ftp.cmdl.noaa.gov/hats/graphs/ |
文件历史
点击某个日期/时间查看对应时刻的文件。
| 日期/时间 | 缩略图 | 大小 | 用户 | 备注 | |
|---|---|---|---|---|---|
| 当前 | 2016年10月2日 (日) 22:00 | | 1,096 × 1,271(123 KB) | Cmdrjameson | Compressed with pngout. Reduced by 46kB (27% decrease). |
| 2009年10月6日 (二) 04:11 |  | 1,096 × 1,271(169 KB) | Robert Skyhawk | Updated information current to 2008. Upload requested by English Wikipedia user Tobus2 via Images for Upload. | |
| 2006年1月15日 (日) 19:38 |  | 1,139 × 1,577(24 KB) | Maksim | La bildo estas kopiita de wikipedia:en. La originala priskribo estas: CFC gas trends and equivalent chlorine effect. Combined chlorine and bromine in the lower stratosphere (10-25 km), where most ozone loss occurs, leveled off around [ |
文件用途
以下页面使用本文件:
全域文件用途
以下其他wiki使用此文件:
- bg.wikipedia.org上的用途
- ca.wikipedia.org上的用途
- el.wikipedia.org上的用途
- en.wikipedia.org上的用途
- eo.wikipedia.org上的用途
- es.wikipedia.org上的用途
- eu.wikipedia.org上的用途
- fi.wikipedia.org上的用途
- fr.wikipedia.org上的用途
- gu.wikipedia.org上的用途
- hi.wikipedia.org上的用途
- id.wikipedia.org上的用途
- kn.wikipedia.org上的用途
- pt.wikipedia.org上的用途
- simple.wikipedia.org上的用途
- ta.wikipedia.org上的用途