
File:NSIDC arctic sea ice extent since 1979.svg

此SVG文件的PNG预览的大小:800 × 533像素。 其他分辨率:320 × 213像素 | 640 × 427像素 | 1,024 × 683像素 | 1,280 × 853像素 | 2,560 × 1,707像素 | 810 × 540像素。
原始文件 (SVG文件,尺寸为810 × 540像素,文件大小:37 KB)
摘要
| 描述 |
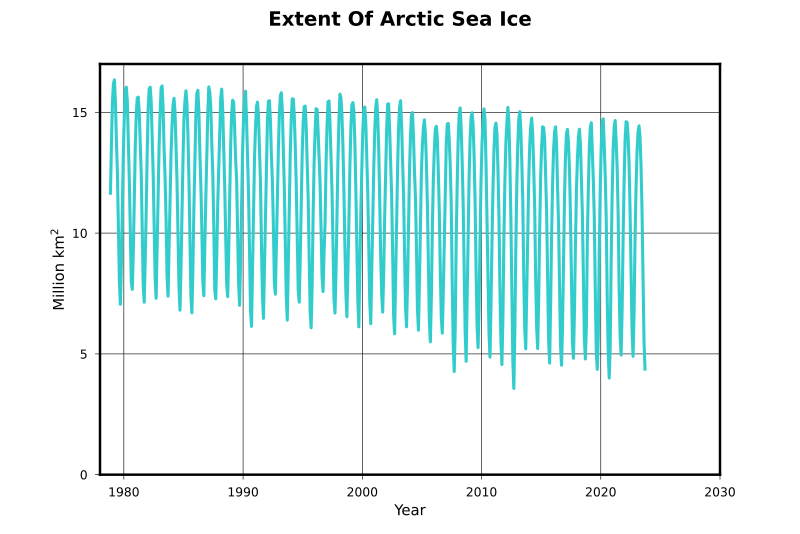
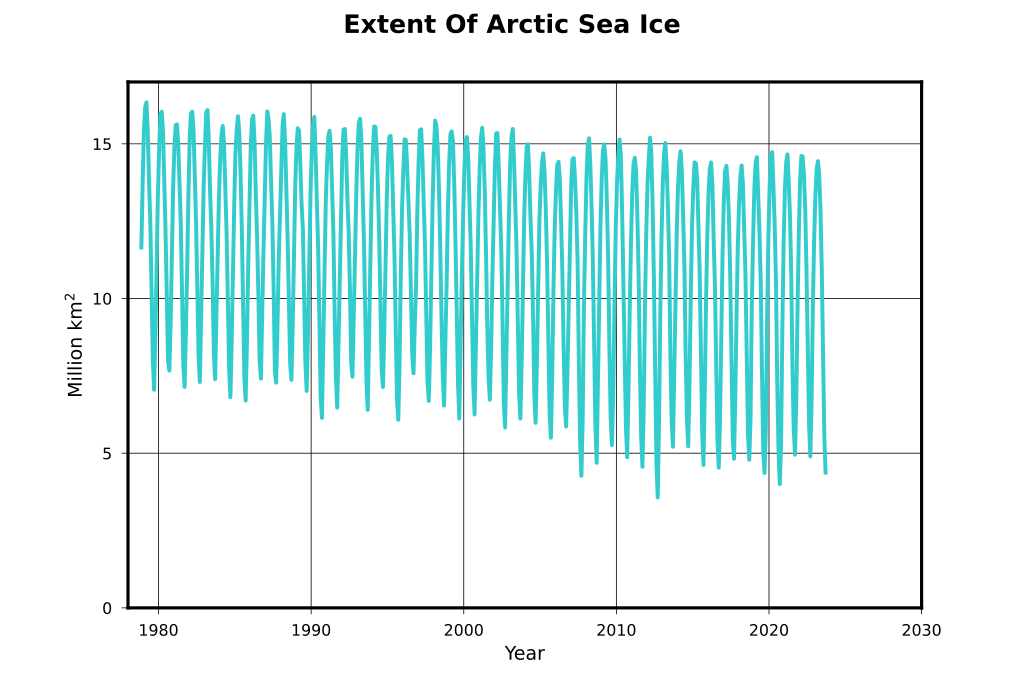
English: Plot of arctic sea ice extent development between 1979 and 2023 in monthly mean values. For the determination of the "area" value, every pixel with a sea ice concentration > .15 is taken. The pixel area is multiplied with the concentration value derived from the passive infrared signal. For the "extent" value, the concentration value is taken as 1, so we basically get full area with >.15 concentration.
Deutsch: Verlauf der Umrissfläche des arktischen Meereises in Monatsmittelwerten von 1979 bis 2023. Für die "area"-Daten werden alle Pixel mit einer Eiskonzentration > 0.15 genommen und deren Fläche mit der Eiskonzentration multipliziert. Für die "extent"-Daten wird diese Eiskonzentration =1 gesetzt - so erhält man die Gesamtfläche mit überhaupt irgendwelchem Eis. |
| 日期 | |
| 来源 | 自己的作品 |
| 作者 | Dominiklenne |
Data source: Fetterer, F., K. Knowles, W. Meier, and M. Savoie. 2002, updated until 2010. Sea Ice Index. Boulder, Colorado USA: National Snow and Ice Data Center. Digital media. ftp://sidads.colorado.edu/DATASETS/NOAA/G02135/. Corresponding website: http://nsidc.org/data/seaice_index/archives/index.html
For the area definition see: https://nsidc.org/learn/ask-scientist/what-difference-between-sea-ice-area-and-extent
许可协议
| 我,本作品著作权人,释出本作品至公有领域。这适用于全世界。 在一些国家这可能不合法;如果是这样的话,那么: 我无条件地授予任何人以任何目的使用本作品的权利,除非这些条件是法律规定所必需的。 |
文件历史
点击某个日期/时间查看对应时刻的文件。
| 日期/时间 | 缩略图 | 大小 | 用户 | 备注 | |
|---|---|---|---|---|---|
| 当前 | 2023年10月23日 (一) 17:48 | | 810 × 540(37 KB) | Dominiklenne | update to october 2023 |
| 2023年5月9日 (二) 21:07 |  | 810 × 540(37 KB) | Dominiklenne | update to april 2023 | |
| 2022年3月4日 (五) 19:12 |  | 810 × 540(36 KB) | Dominiklenne | update until february 2022 | |
| 2020年11月7日 (六) 00:39 |  | 810 × 540(42 KB) | Dominiklenne | update until october 2020 | |
| 2019年10月27日 (日) 17:16 |  | 810 × 540(45 KB) | Dominiklenne | data added until september 2019, year scale extended to 2030 | |
| 2018年10月30日 (二) 22:35 |  | 810 × 540(47 KB) | Dominiklenne | data updated until september 2018 | |
| 2017年7月8日 (六) 22:44 |  | 810 × 540(47 KB) | Dominiklenne | data updated until june 2017 | |
| 2016年7月22日 (五) 21:43 |  | 810 × 540(47 KB) | Dominiklenne | data updated until june 2016 | |
| 2015年8月27日 (四) 21:43 |  | 810 × 540(40 KB) | Dominiklenne | minor y scale change to the same as in https://commons.wikimedia.org/wiki/File:Plot_arctic_sea_ice_area.svg | |
| 2015年8月27日 (四) 17:03 |  | 810 × 540(40 KB) | Dominiklenne | update until 2015 / 07. Use of python matplotlip pyplot instead of Gnumeric. Slightly different y-scale for better exhaustion of plot area. |
文件用途
以下页面使用本文件:
全域文件用途
以下其他wiki使用此文件:
- ar.wikipedia.org上的用途
- bn.wikipedia.org上的用途
- de.wikipedia.org上的用途
- en.wikipedia.org上的用途
- fa.wikipedia.org上的用途
- fr.wikipedia.org上的用途
- it.wikipedia.org上的用途
- ko.wikipedia.org上的用途
- la.wikipedia.org上的用途
- mk.wikipedia.org上的用途
- nn.wikipedia.org上的用途
- no.wikipedia.org上的用途
- sq.wikipedia.org上的用途
- sv.wikipedia.org上的用途
- uk.wikipedia.org上的用途