File:Associated Legendre Poly.svg

页面内容不支持其他语言。
這個文件來自維基共享資源
维基百科,自由的百科全书

原始文件(SVG文件,尺寸为540 × 360像素,文件大小:48 KB)


摘要

描述
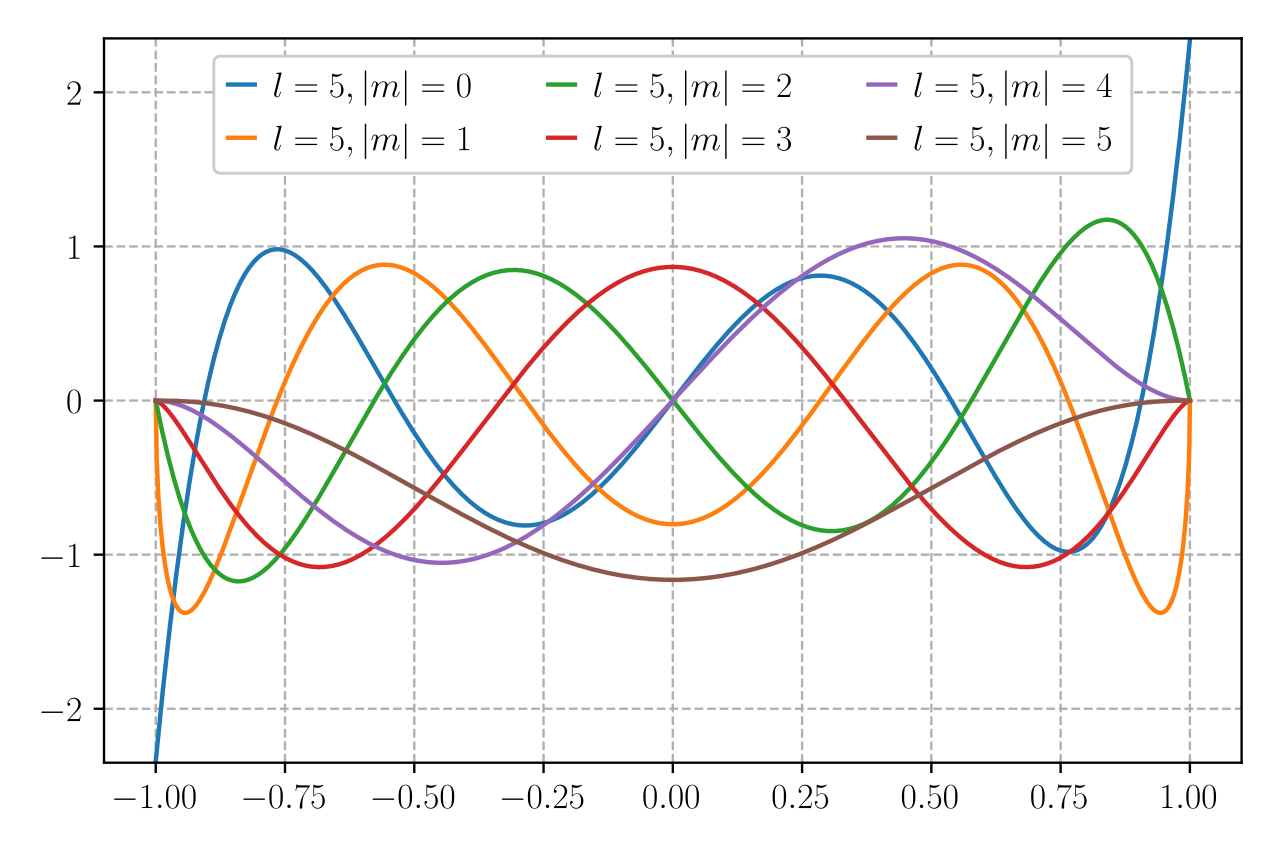
English: Curves of Associated Legendre function. The functions are normalized, i.e. what is plotted is
日期
来源 自己的作品
作者 Krishnavedala
SVG开发
InfoField
 
SVG的源代码为有效代码
 
矢量图使用Matplotlib创作。
源代码
InfoField

Python code

Source code
#include    <stdio.h>
#include    <stdlib.h>
#include    <math.h>
#include    <unistd.h>
#include    <gsl/gsl_sf_legendre.h>
#include    <plplot/plplot.h>

#ifndef PI
#define PI    3.1415926535897932384
#endif

#define		modulus(a)		(a > 0 ? a : -a)

typedef struct quant_num
{
	int l, m, n;
} quant_num;

const long unsigned int NUM_PTS = 5000;
const PLINT XMAX = 1;
const PLINT YMAX = 1;

void aLegendre(PLFLT *x, PLFLT *y, quant_num *numbers)
{
	long unsigned int i = 0;
	float step = 2.0/NUM_PTS, t = -1.0;
	
	while(t < 1.0 && i < NUM_PTS)
	{
		x[i] = (PLFLT)t;
		y[i] = (PLFLT)gsl_sf_legendre_sphPlm(numbers->l, abs(numbers->m), (const double)t);
		i++;
		t += step;
	}
}

void drawlegend(int n)
{
	PLINT 	nLegend = n+1;
	char 	*text[nLegend];
	int i;
	PLINT	opt_array[nLegend];
	PLINT	text_colors[nLegend];
	PLINT	line_colors[nLegend];
	PLINT	line_styles[nLegend];
	PLINT	line_widths[nLegend];
	PLINT 	symbol_numbers[nLegend];
	PLINT 	symbol_colors[nLegend];
	PLINT 	symbols[nLegend];
	PLFLT	symbol_scales[nLegend];
	PLINT	box_colors[nLegend] = {15};
	
	symbol_numbers[n] = n;
	symbol_colors[n] = n;
	symbols[n] 		 = '.';
	symbol_scales[n] = 1.;
	
	for(i = 0; i <= n; i++)
	{
		text[i] = malloc(15 * sizeof(char));
		if(i>0)
			sprintf(text[i], "l=5, &#124;m&#124;=%d",i);
		else
			sprintf(text[i], "l=5, m=%d",i);
		line_colors[i]	= i+1;
		line_styles[i]	= 1;
		line_widths[i]	= 1;
		text_colors[i] 	= 15;
		opt_array[i] 	= PL_LEGEND_LINE;
	}
	
	pllegend(0, 0.72, .87, .05, 15,
		nLegend, opt_array, 0.5, 0.7, 1.5, 0,
		text_colors, (const char**) text, 
		box_colors, NULL, NULL, 
		line_colors, line_styles, line_widths,
		symbol_colors, symbol_scales, symbol_numbers, symbols);
	for(i = 0; i <= n; i++)
		free(text[i]);
}

int main(void)
{
    PLFLT X[NUM_PTS], Y[NUM_PTS];
    quant_num test_num[6];
    int i;
	
    plscol0(0, 255, 255, 255);
    plinit();
    plscol0(15, 0, 0, 0);
    plcol(15);
    plenv(-XMAX,XMAX, -YMAX,YMAX, 0, 2);

    pllab("x", "P#dl#u#um#d(x)", "Associated Legendre Polynomials");
    plbox( "bcnst", 0, 0, "bcnstv", 0, 0);    plcol(1);
    for(i = 0; i <= 5; i++)
    {
		test_num[i].l = 5; 	test_num[i].m = i; 	test_num[i].n = 1; 
		orbital(X, Y, &test_num[i]); plcol(i+1);
		plline(NUM_PTS, X, Y);
    }

    drawlegend(test_num[0].l);
    
    plend();

    return 0;
}

Data

Source code
import matplotlib.pyplot as plt
from scipy.special import lpmv
import numpy as np
plt.rc('svg', fonttype='none')
plt.rc('text', usetex=1)

dt = 1e-3
l = 5
x = np.arange(-1, 1, dt)
y = []
for m in range(l+1):
    y.append(lpmv(m, l, x))
    
fig, ax = plt.subplots(1,1, figsize=(10,6))
for m in range(l+1):
    ax.plot(x, y[m] / np.linalg.norm(y[m]), label=r'$l=%d, &#124;m&#124;=%d$' % (l, m))
ax.grid(True)
ax.legend()
ax.minorticks_on()
ax.set_xlim([-1,1])
ax.set_xlabel(r'$x$')
ax.set_ylabel(r'$P_l^m(x)$')
fig.savefig('legendre.svg', bbox_inches='tight')

许可协议

我,本作品著作权人,特此采用以下许可协议发表本作品:
w:zh:知识共享
署名 相同方式共享
您可以自由地:
  • 共享 – 复制、发行并传播本作品
  • 修改 – 改编作品
惟须遵守下列条件:
  • 署名 – 您必须对作品进行署名,提供授权条款的链接,并说明是否对原始内容进行了更改。您可以用任何合理的方式来署名,但不得以任何方式表明许可人认可您或您的使用。
  • 相同方式共享 – 如果您再混合、转换或者基于本作品进行创作,您必须以与原先许可协议相同或相兼容的许可协议分发您贡献的作品。
GNU head 已授权您依据自由软件基金会发行的无固定段落及封面封底文字(Invariant Sections, Front-Cover Texts, and Back-Cover Texts)的GNU自由文件许可协议1.2版或任意后续版本的条款,复制、传播和/或修改本文件。该协议的副本请见“GNU Free Documentation License”。
您可以选择您需要的许可协议。

说明

添加一行文字以描述该文件所表现的内容

此文件中描述的项目

描繪內容

image/svg+xml

16ecdc42e0ba939e12c1f09283ede01be5608034

49,502 字节

360 像素

540 像素

文件历史

点击某个日期/时间查看对应时刻的文件。

日期/时间缩⁠略⁠图大小用户备注
当前2020年12月3日 (四) 20:382020年12月3日 (四) 20:38版本的缩略图540 × 360(48 KB)AkanoToEAdjusted normalization, legend formatting, and text formatting
2018年4月24日 (二) 22:052018年4月24日 (二) 22:05版本的缩略图785 × 466(69 KB)KrishnavedalaReverted to version as of 21:58, 24 April 2018 (UTC) - fonts not rendered properly on wiki
2018年4月24日 (二) 22:042018年4月24日 (二) 22:04版本的缩略图795 × 468(47 KB)Krishnavedalaremoved embedded fonts - smaller file size
2018年4月24日 (二) 21:582018年4月24日 (二) 21:58版本的缩略图785 × 466(69 KB)Krishnavedalarecreated better clarity and smaller size
2010年11月25日 (四) 14:312010年11月25日 (四) 14:31版本的缩略图900 × 675(508 KB)Krishnavedala{{Information |Description={{en|1=Curves of Associated Legendre function generated in C program using the PLplot library.}} |Source={{own}} |Author=[[User:Krishnavedala|

以下页面使用本文件:

全域文件用途

以下其他wiki使用此文件:

元数据